Docs · User manual
A guided tour of Photon Ledger
Photon Ledger is a desktop app that recursively scans a folder of astrophotography FITS sub-frames, reads each frame's header, normalizes the target, filter, and equipment names, and tallies how much integration time you've collected per target, per filter, per night. Everything is stored in a local database on your machine — nothing is uploaded.
This manual walks through the app end to end. Every screenshot was generated from a real library — 9,434 frames across 21 targets totaling 153h 12m of integration — so the numbers and thumbnails you see are genuine output, not mock-ups.
On this page
- Connect your database
- The dashboard before your first scan
- Scan your library
- Your dashboard, populated
- Browse your targets
- Target detail
- Frames & quality
- Export a target's frames to a folder
- Activity over time
- New-additions report
- Equipment summary
- Tonight's Picks — the planner
- Settings
1. Connect your database
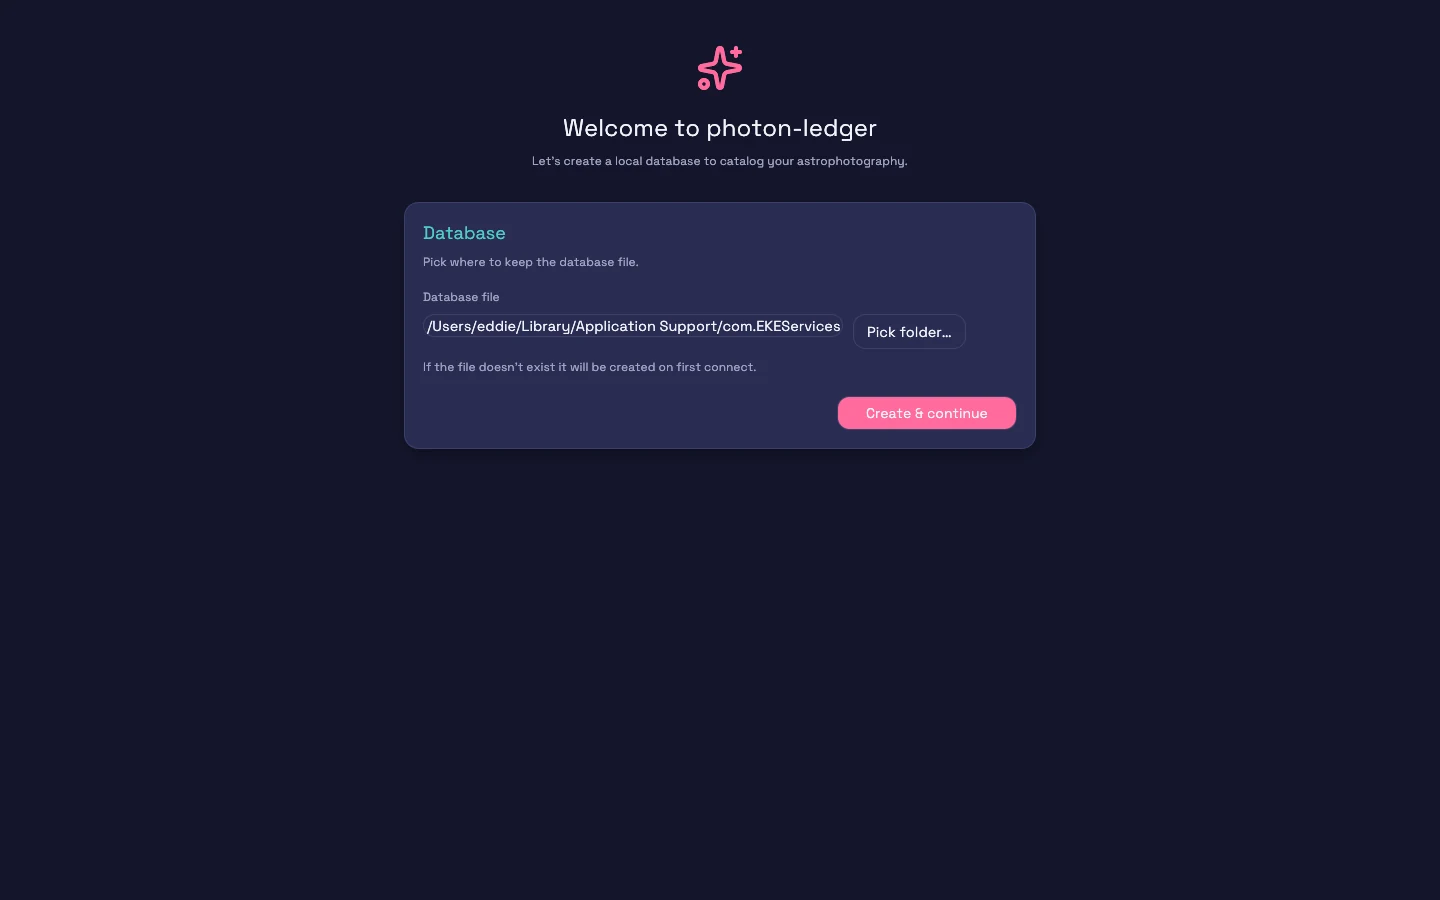
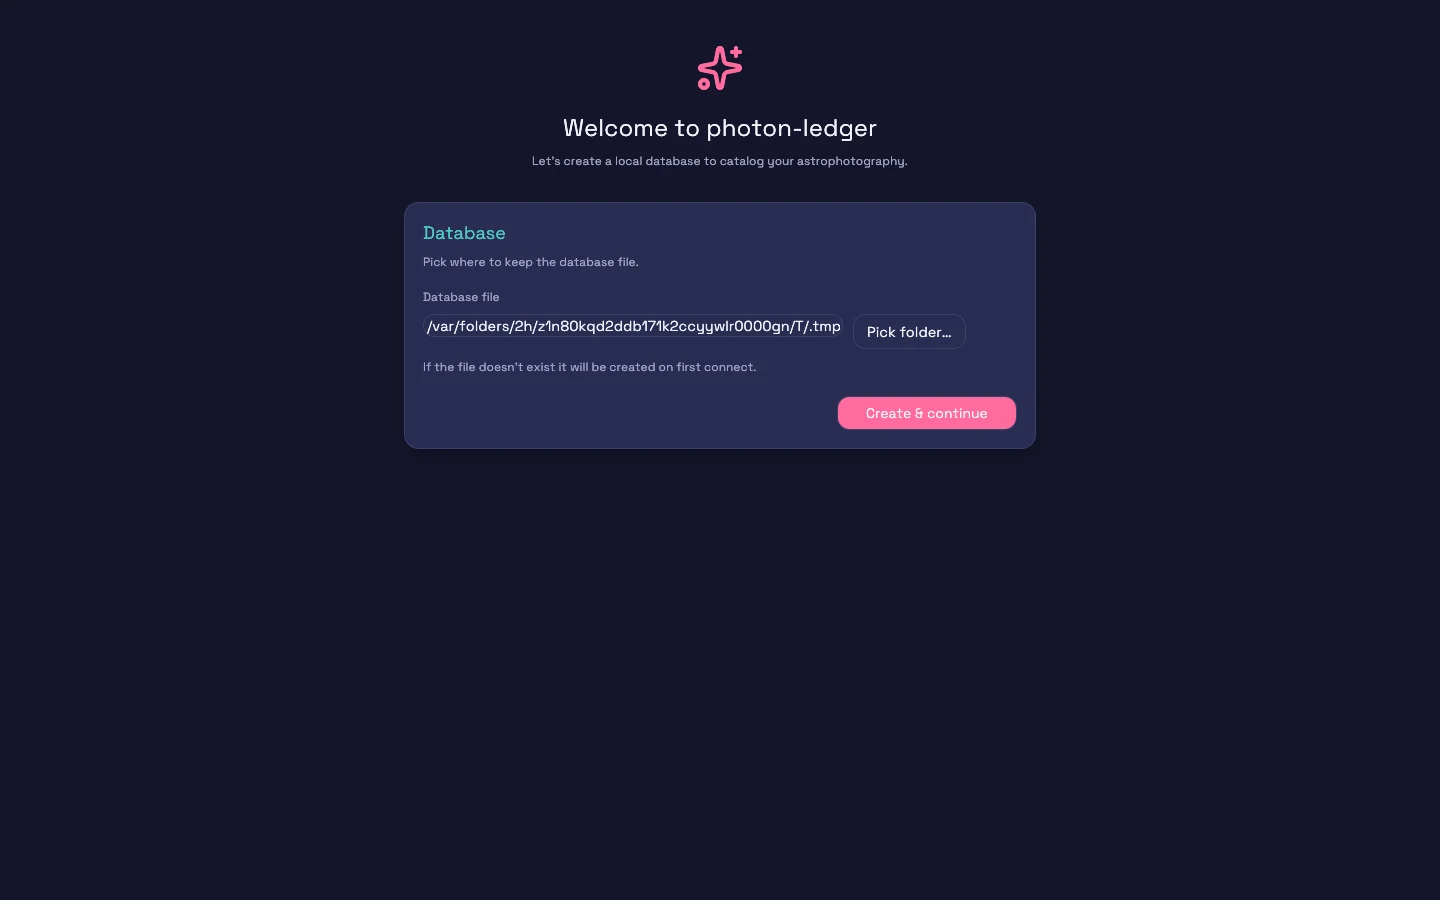
On first launch Photon Ledger asks where to keep its catalog. SQLite is the default and needs zero setup — it's a single file on disk, and it's all most people ever need. (Postgres is available for shared or very large catalogs.)
Pick a location with Choose…, or paste a path into the field, then press Create & continue. The database is created and you land on the dashboard. You can move or change it later from Settings.
2. The dashboard before your first scan
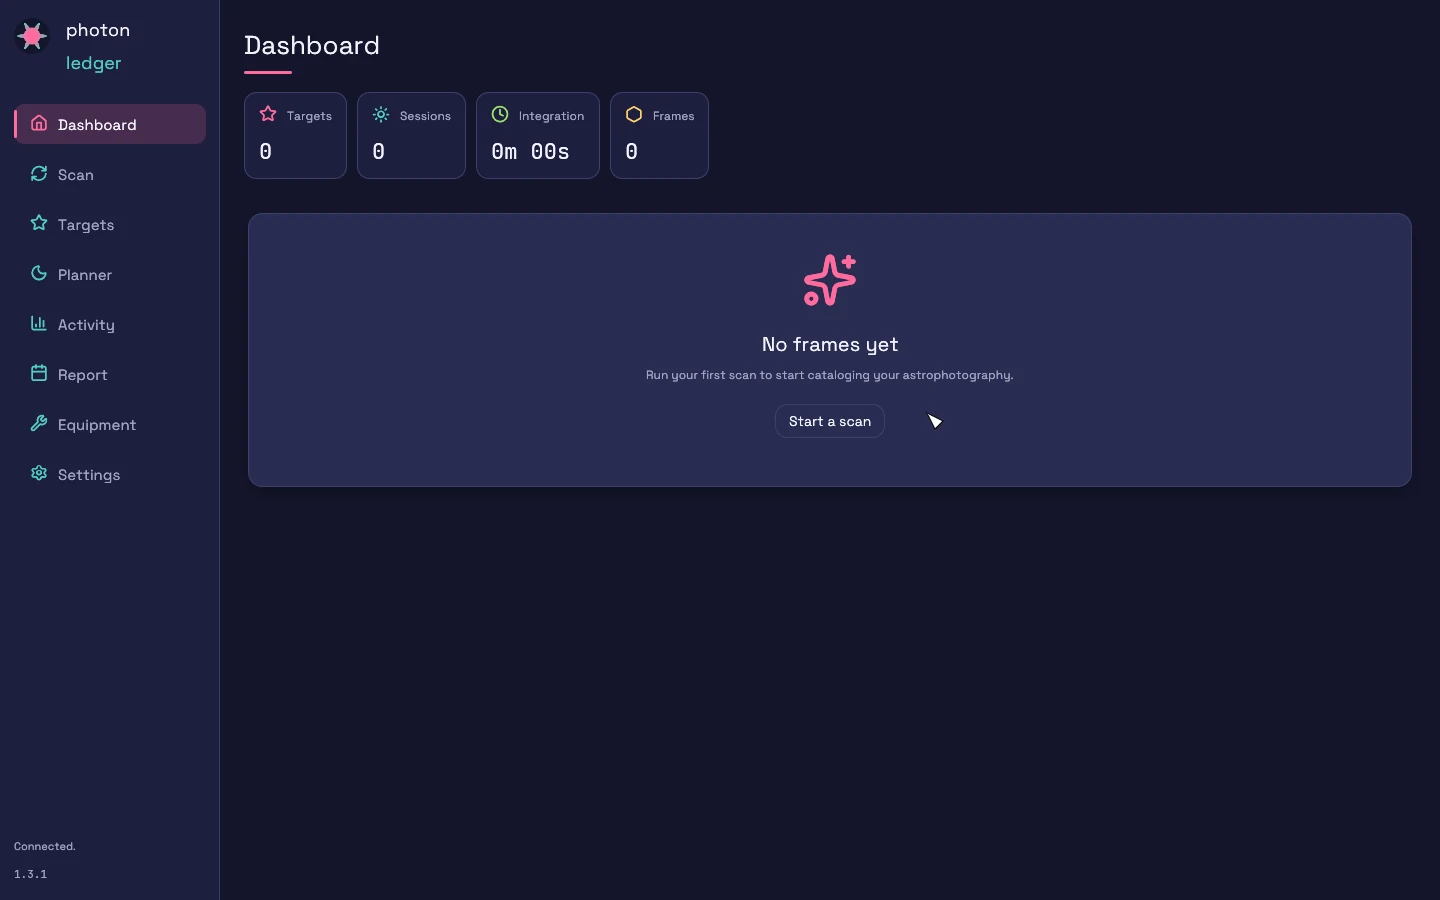
A fresh catalog is empty — zero targets, zero frames. The four counters at the top (Targets, Sessions, Integration, Frames) are the vital signs of your whole library and will fill in after you scan.
Press Start a scan to point the app at your sub-frames.
3. Scan your library
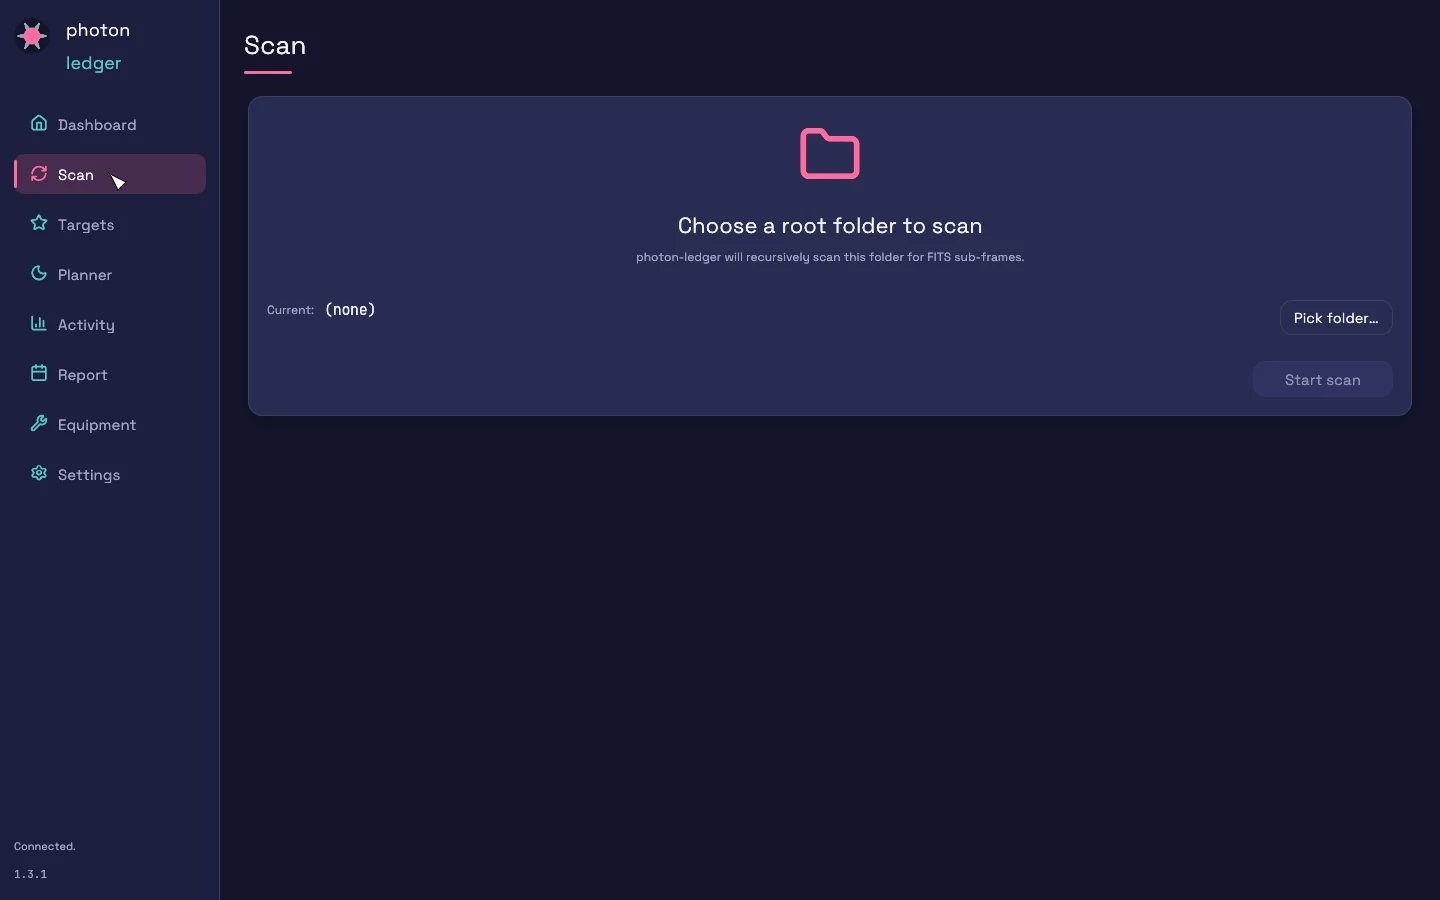
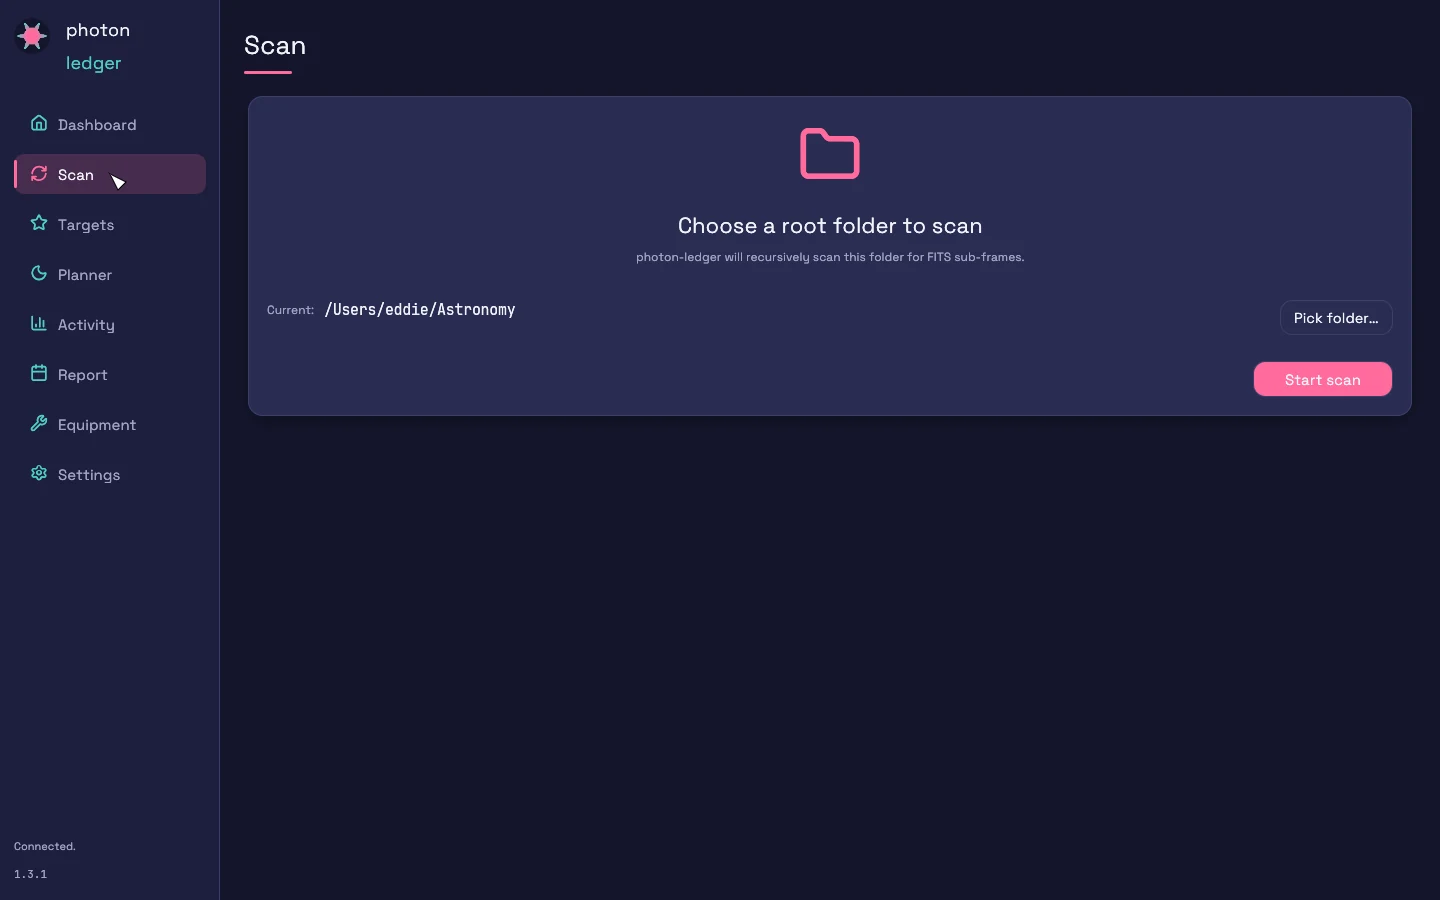
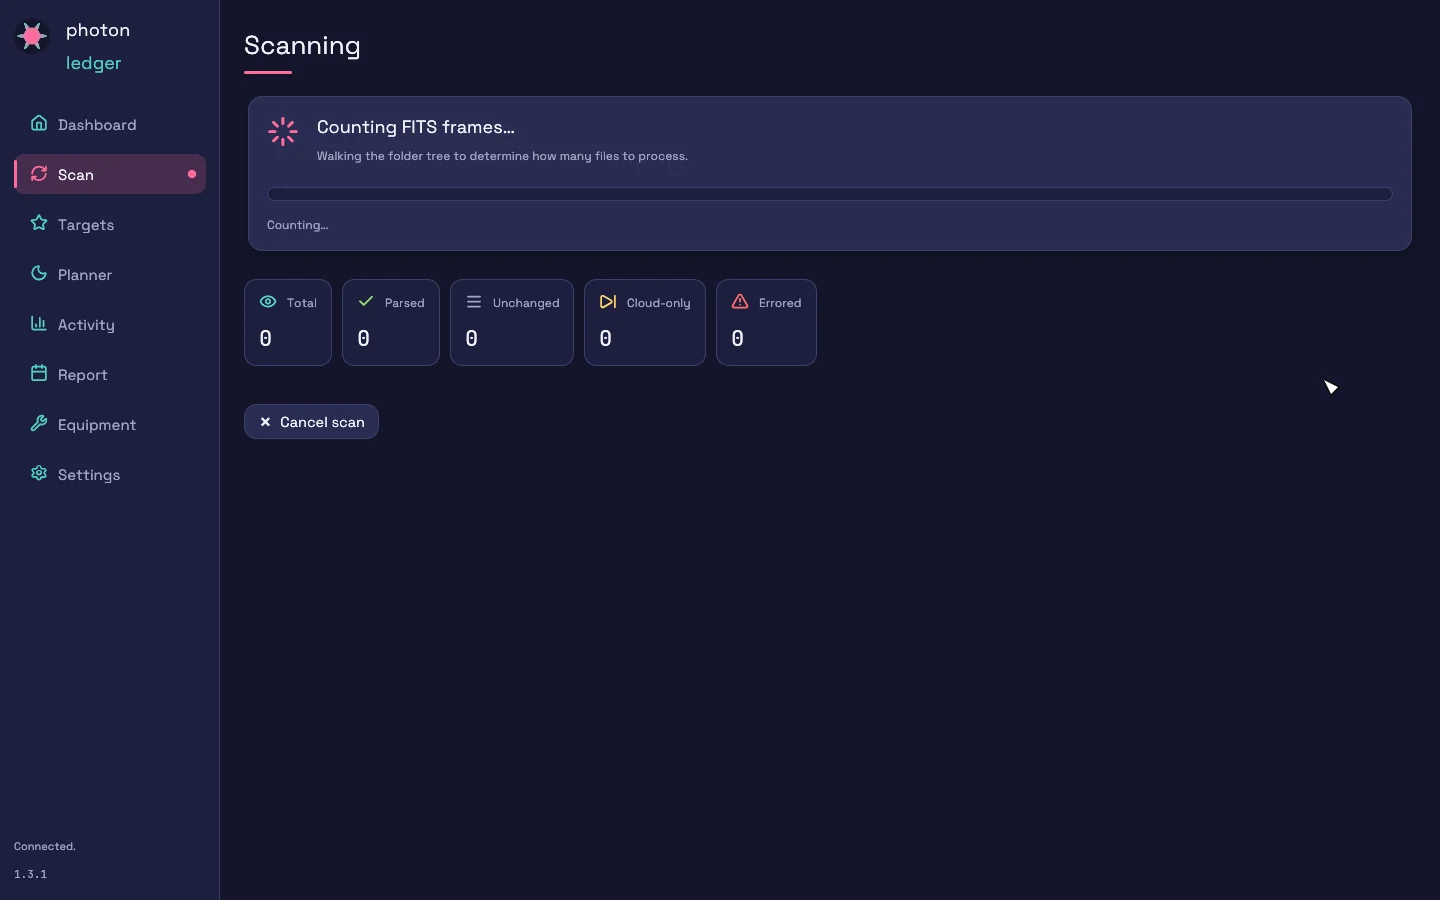
Choose the top folder that contains your captures — Photon Ledger walks it recursively, so one parent folder covering every target and every night is usually all you need. Point it at the root and press Start scan.
During a scan the app walks the tree, reads each FITS header, and batches results into the database. Re-scanning later is cheap: already-indexed files are fingerprinted by path and modification time and skipped, so only new or changed frames are re-read.
If any files fail to read, an Errored files card appears on the Scan screen listing each failing path and the reason — expand it to see exactly which files need attention, or Copy list to take them elsewhere. When the scan finishes, a toast in the top-right corner reports the result no matter which screen you're on.
Keep your library in OneDrive, iCloud Drive, or Dropbox? Sub-frames that are still "online-only" (synced on demand and not yet downloaded to disk) are counted under Cloud-only and skipped — they are not treated as read errors. Download those files in your cloud client ("Always keep on this device") and re-scan to index them.
4. Your dashboard, populated
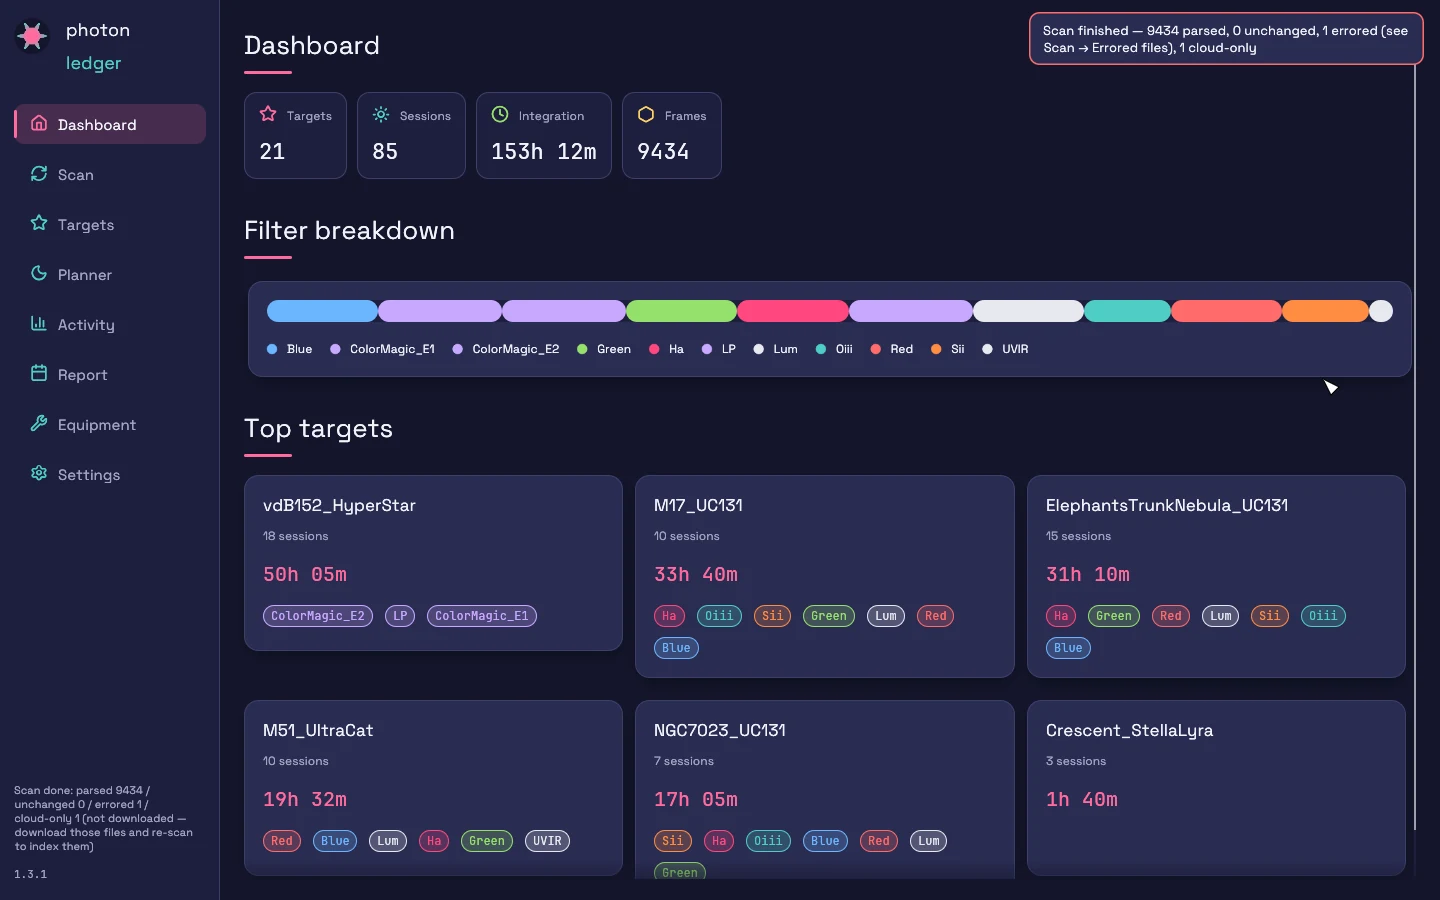
Once the scan finishes, the dashboard summarizes everything at a glance: here, 21 targets · 85 sessions · 153h 12m · 9,434 frames. The four stat tiles are buttons — click Targets to jump to the target grid, Sessions or Integration for the Activity charts, Frames for the new-additions report. The Filter breakdown bar shows how your total integration splits across filters (Ha, OIII, SII, LRGB, light-pollution, and so on), and Top targets cards rank what you've spent the most time on.
The footer line keeps the last scan result as passive history — including any frames that couldn't be read, so you can spot corrupt or non-standard files.
5. Browse your targets
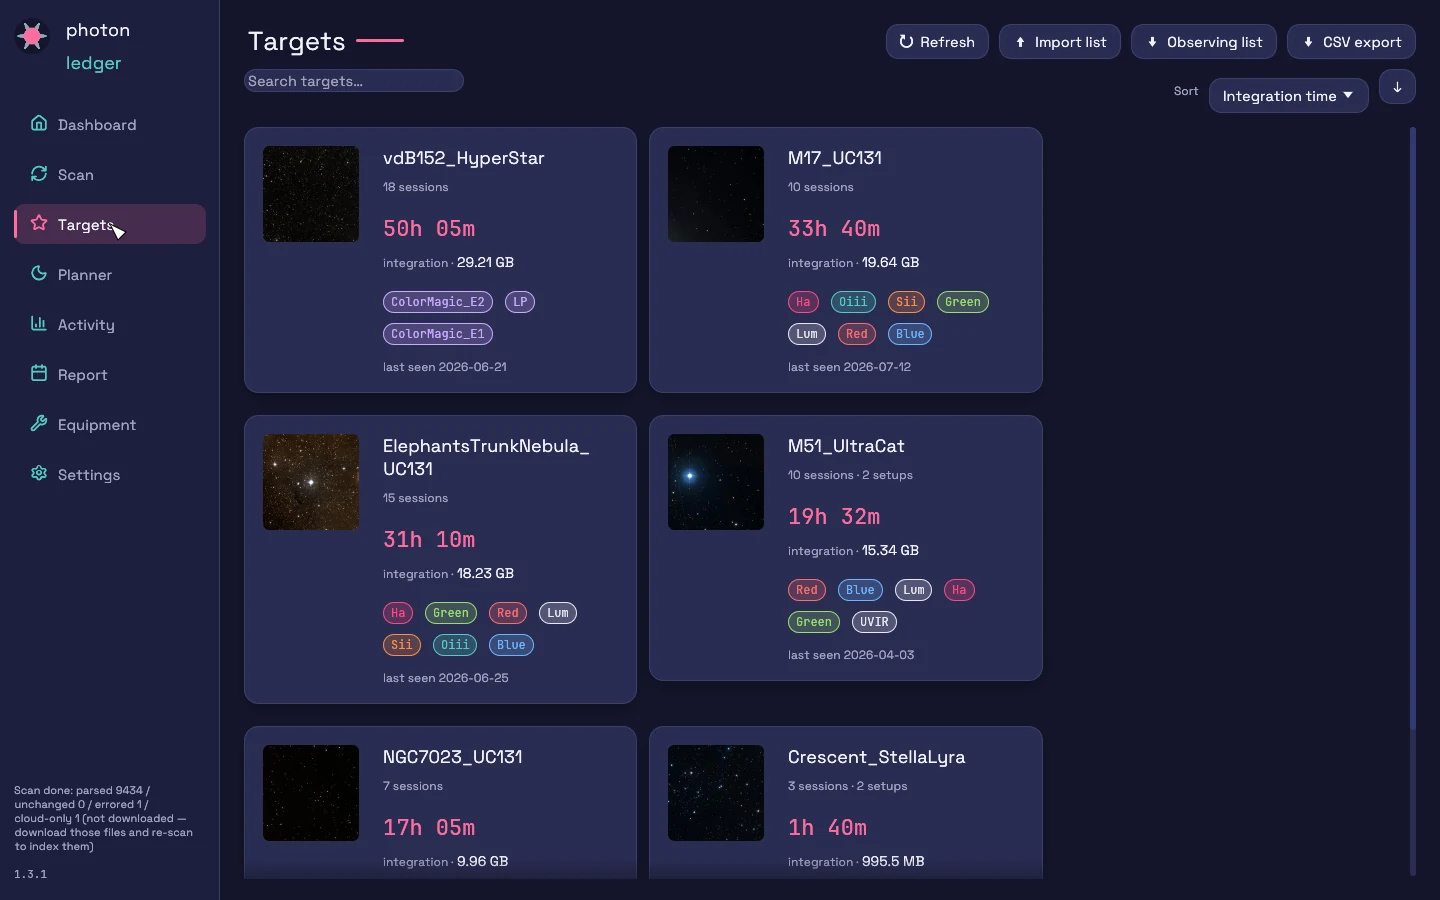
The Targets tab is one card per object. Each card shows total integration, disk footprint, the filters you've shot it in, how many equipment setups were involved, and when you last imaged it. The thumbnail is a real sky cutout for that patch of sky, so the grid is scannable by eye.
Sort by integration time, name, or last-seen; search by name; and use the top-right actions to import an observing list or export one. A "2 setups" badge flags a target imaged on more than one rig — a cue that those frames may not stack together cleanly.
6. Target detail
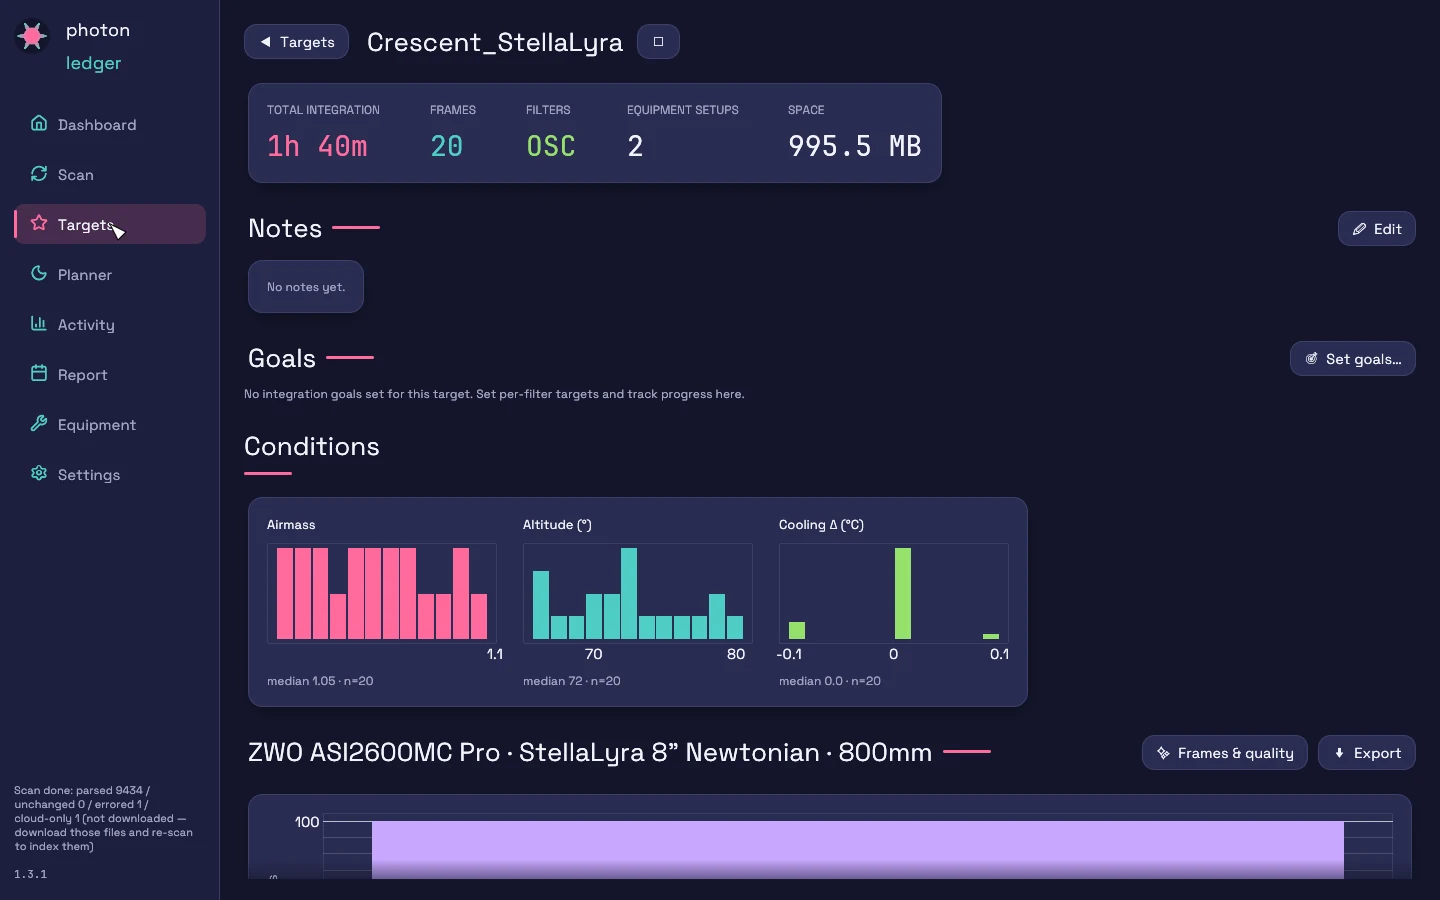
Opening a target breaks it down completely. The header gives total integration, frame count, distinct filters (an OSC rig with no filter wheel shows OSC, not a confusing zero), number of equipment setups, and disk space. The ⋯ menu next to the title lets you rename the target (the display name only — scans keep bucketing by the FITS header name) or merge it into another target when header chaos has split one object across two entries; a merge moves every session across and remembers the old name, so future re-scans won't resurrect the duplicate. Below that you can add notes and set per-filter integration goals to track progress toward a finished image.
The Conditions histograms summarize the airmass, altitude, and sensor cooling your frames were captured under — a quick read on how consistent a target's data is. Everything is then grouped by equipment setup (camera · telescope · focal length). Each setup has a Frames & quality button and a single Export menu gathering everything that produces a file: Copy frames to folder…, Session summary CSV, Per-frame CSV, and AstroBin acquisition CSV — each entry explains what it writes when you hover it. Press Escape anywhere on this screen to go back to the target grid.
7. Frames & quality
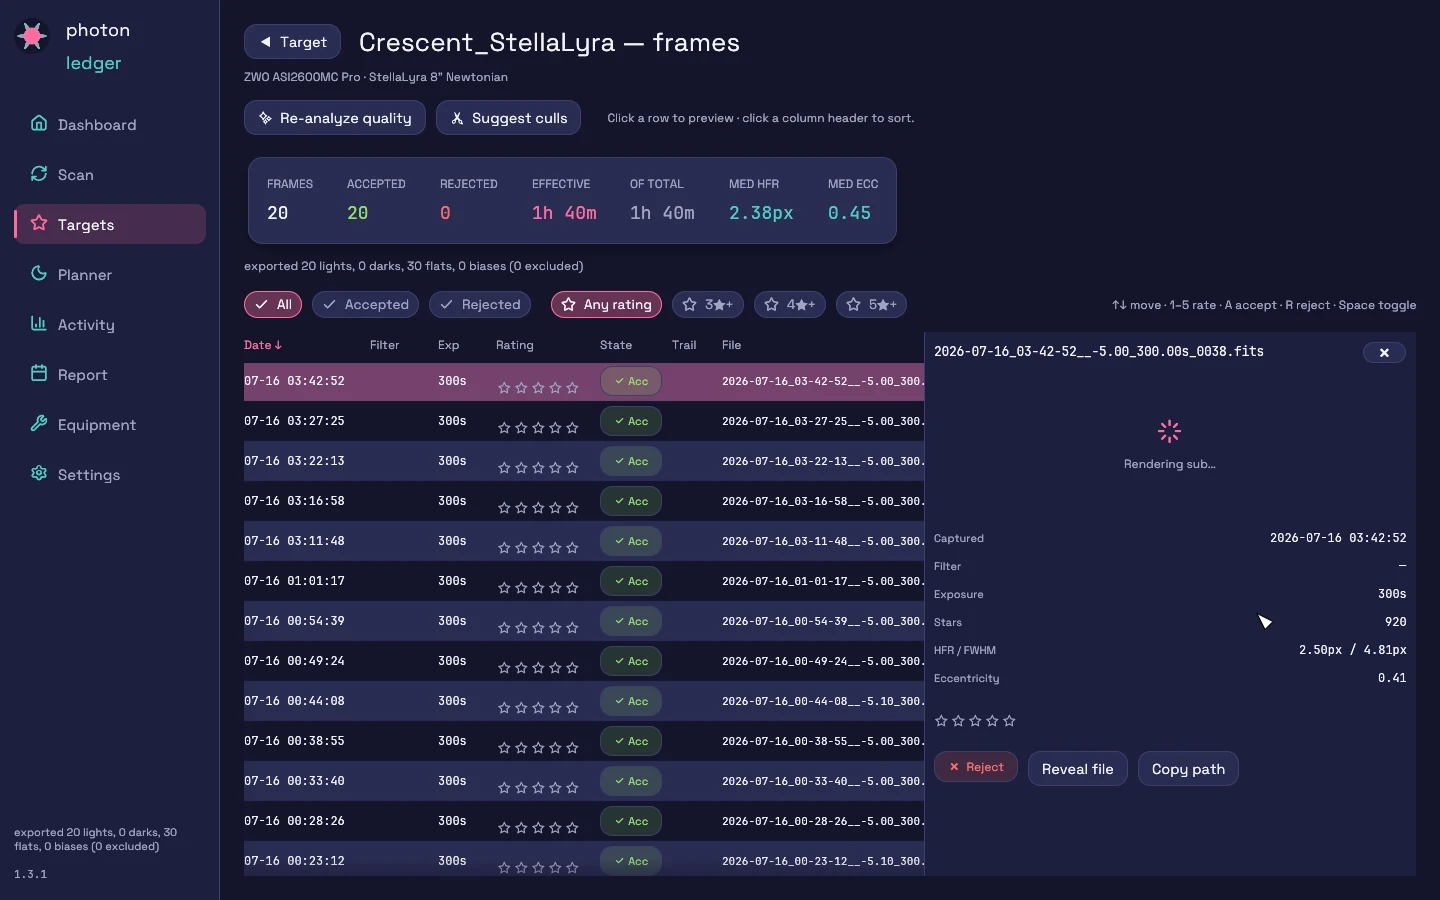
From a target's setup you can open the per-frame quality view. Press Re-analyze quality and Photon Ledger measures each sub — star count, HFR (focus / sharpness), FWHM, eccentricity (guiding / tracking roundness), and satellite trails — and shows summary medians up top. A ☄ Trail column and a TRAILS counter flag any sub crossed by a satellite, airplane, or meteor streak.
Every row carries the exposure's start time and its file name — hover the name for the full path, or right-click it to reveal the file in Finder/Explorer or copy its path. Click a row to preview the sub: a panel opens on the right with the stretched image, its measurements, and the same rate/accept/reject controls, so you can judge a frame by its pixels without leaving the app.
Culling is built to be done from the keyboard: ↑/↓ move through the list with the preview following, 1–5 rate the current sub (0 clears), A accepts, R rejects, Space toggles, and Escape backs out (preview → selection → back to the target). Shift-click selects a range and ⌘/Ctrl-click adds single rows — bulk Accept/Reject buttons appear for multi-selections. Chips above the table narrow the view by filter, curation state, or minimum rating.
Sort by any column — including the Trail and Reason columns — to find your worst frames. Suggest culls reviews the analyzed frames and proposes rejects without applying them: a banner summarizes how many are statistical outliers (compared within each filter, so narrowband and broadband subs aren't judged against one another) versus satellite trails, and the flagged rows are highlighted with their reason. Click Apply to reject them all, or Clear to dismiss. Rejected frames — including trail-affected ones, kept as their own category — can then be excluded from exports so only your keepers move on to stacking.
8. Export a target's frames to a folder
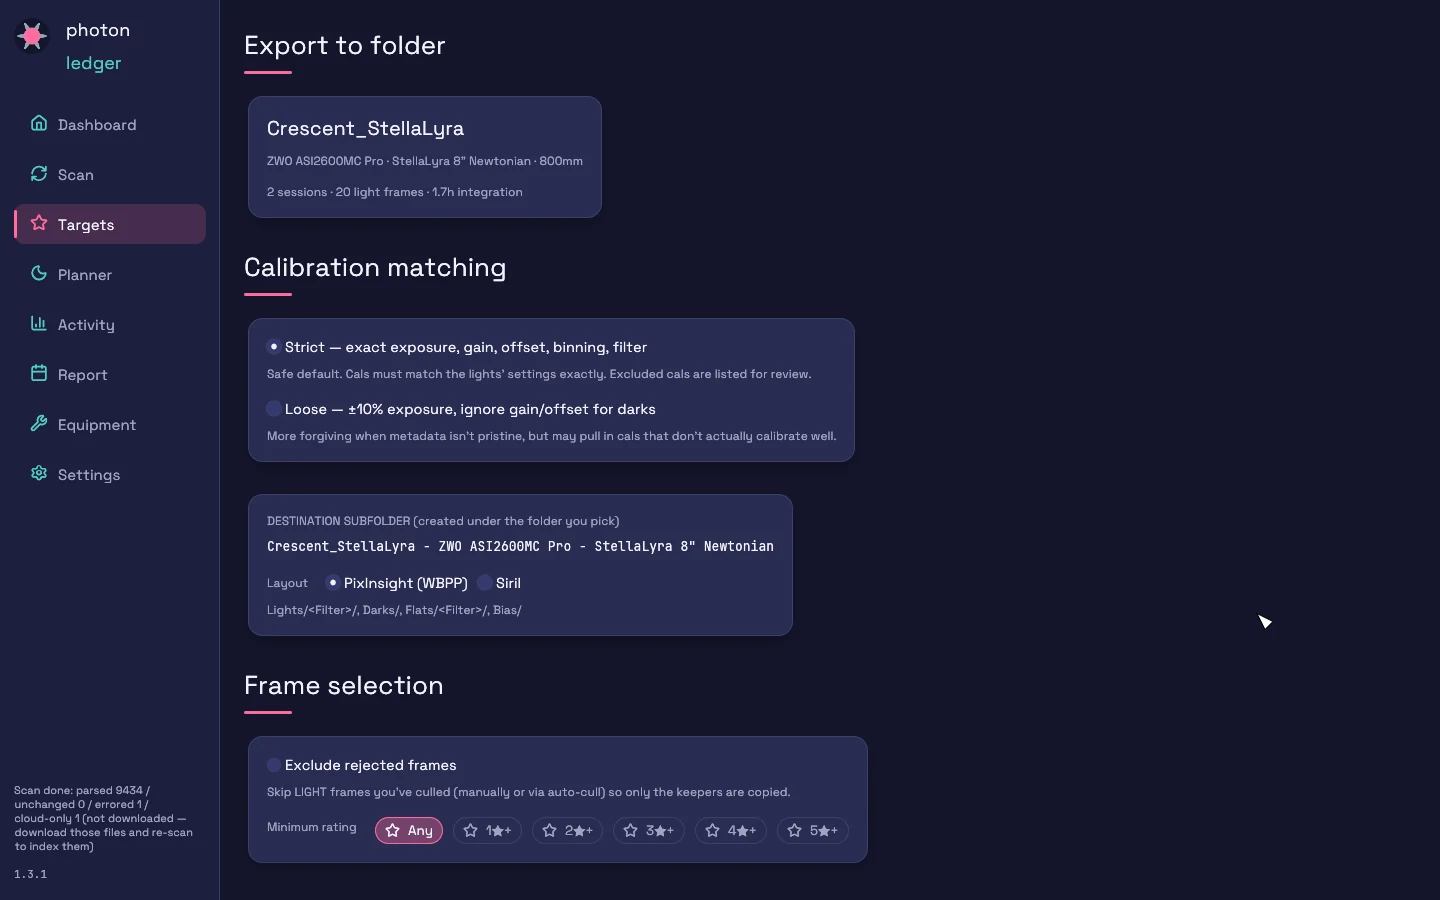
When you're ready to process a target, choose Export → Copy frames to folder… on its setup: Photon Ledger copies exactly the right frames — lights plus their matching calibration — into a clean, stacker-ready folder tree. Calibration matching lets you choose Strict (cals must match exposure, gain, offset, binning, and filter exactly) or Loose (±10% exposure, more forgiving when metadata isn't pristine). Pick a destination layout for PixInsight (WBPP) or Siril, and optionally exclude rejected frames or those below a rating.
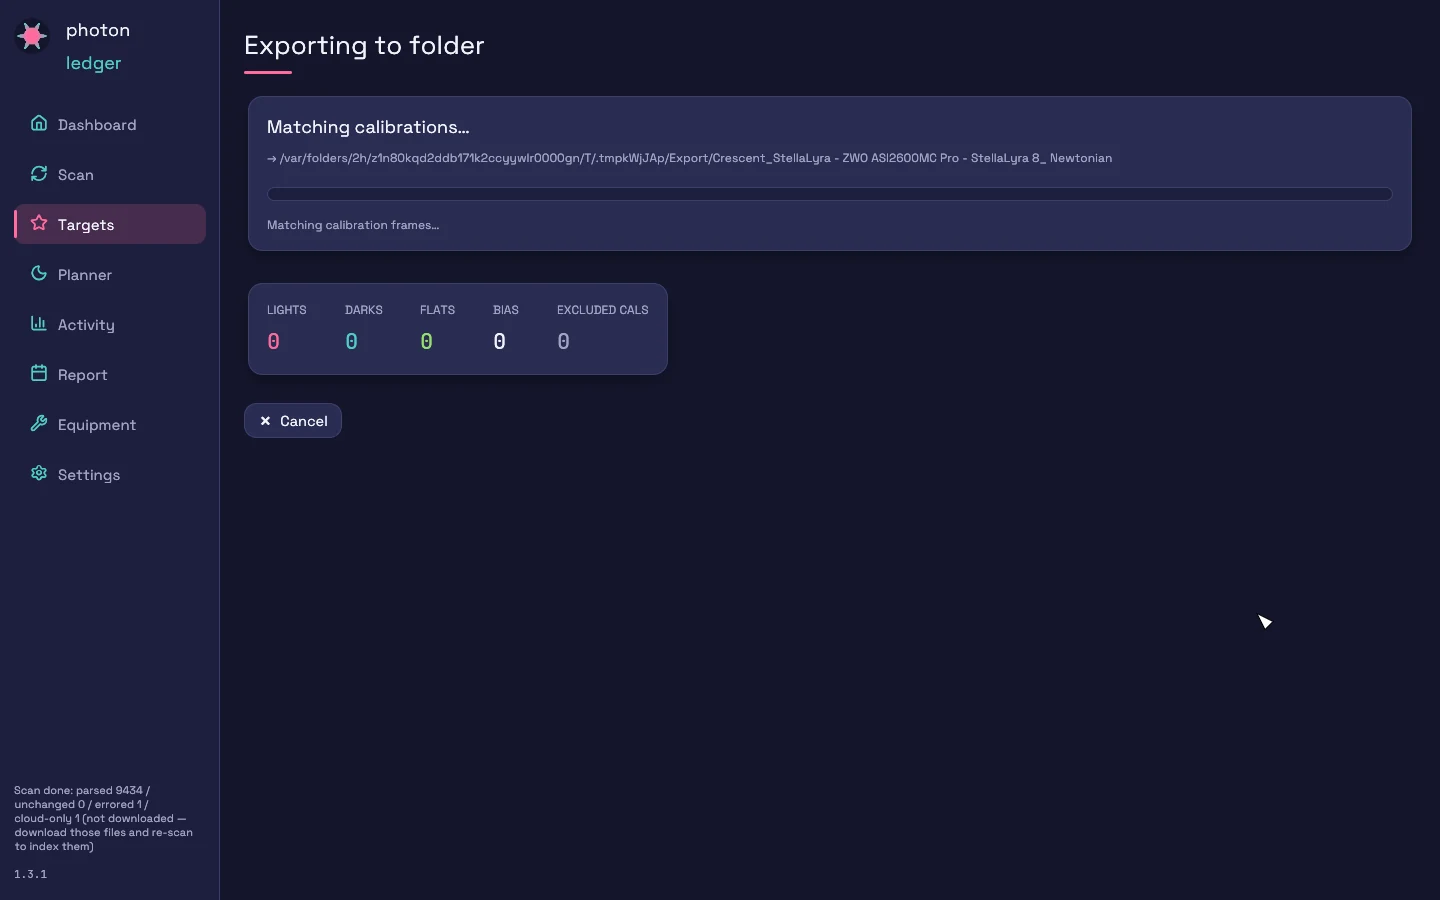
The copy runs in the background with live progress — files copied, bytes moved, and a per-type tally of lights, darks, flats, and biases — and can be cancelled. See the dedicated Folder Export guide for the full output layout.
9. Activity over time
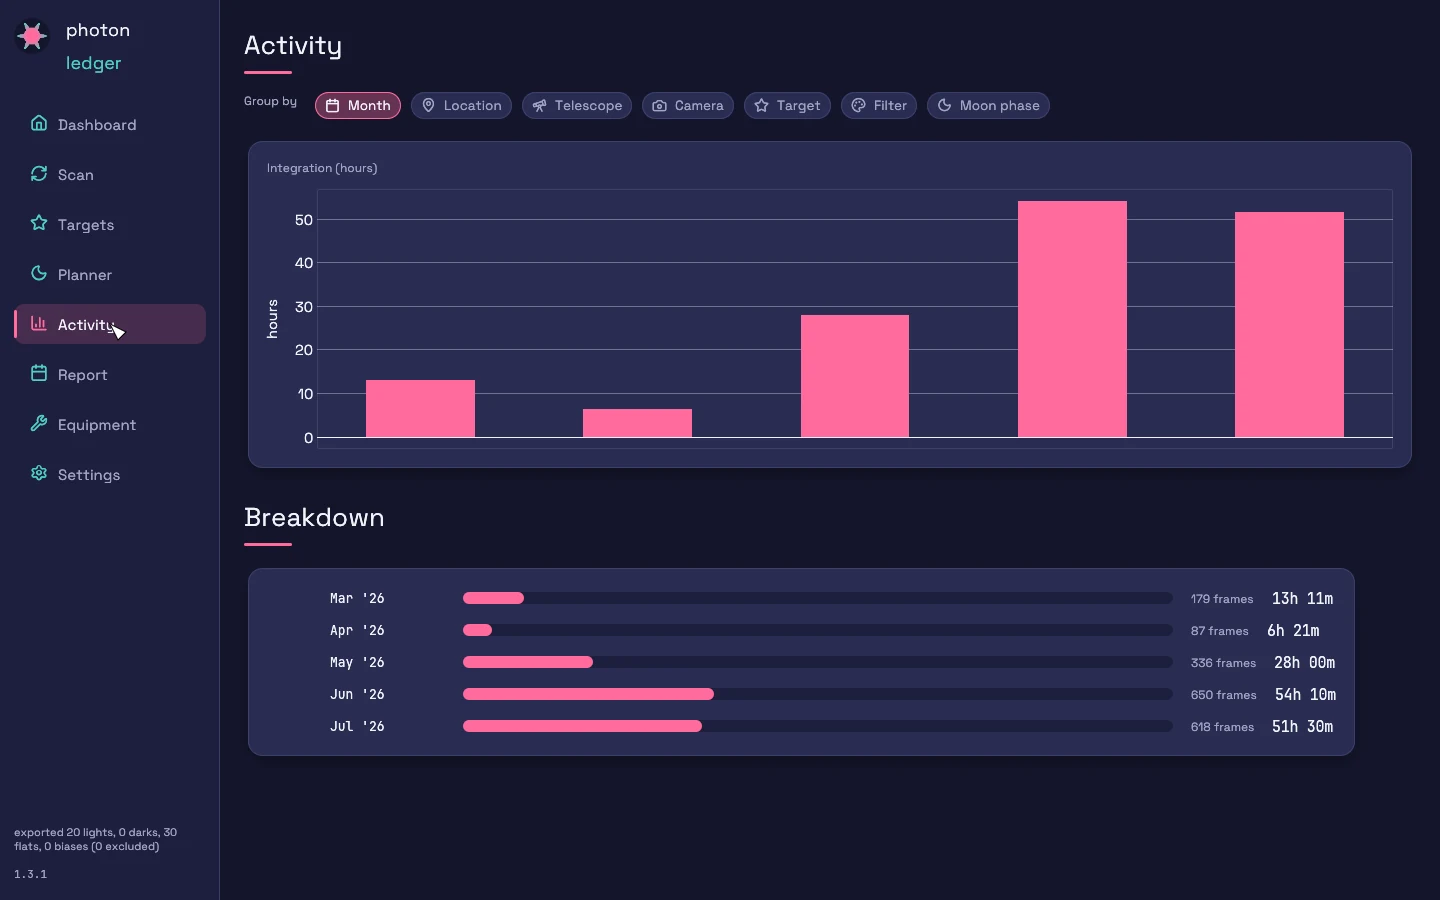
The Activity tab charts how much you've imaged over time and lets you regroup the same data by month, location, telescope, camera, target, filter, or moon phase. The breakdown list underneath gives exact integration and frame counts per bucket — an easy way to see, for example, that June was your most productive month at 54h 10m across 650 frames.
10. New-additions report
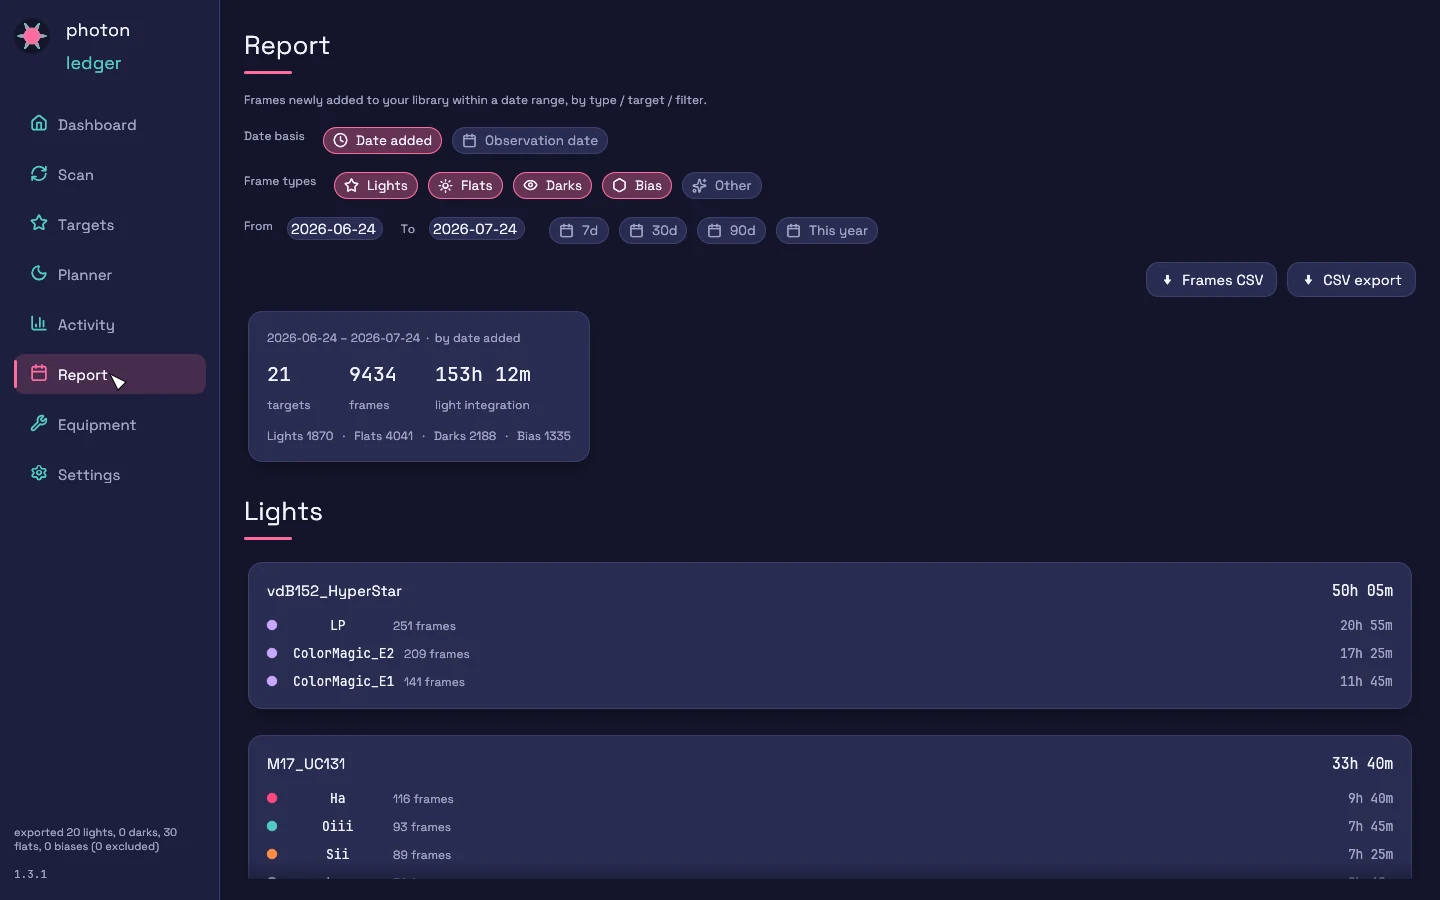
The Report tab answers "what did I add recently?" Pick a date range (or a quick 7 / 30 / 90-day / this-year preset) and whether to measure by date added or observation date, then filter by frame type. You get a summary — targets, frames, and light integration for the window, with a lights / flats / darks / bias split — followed by a per-target, per-filter breakdown. Export the report to CSV for your records or an observing log.
11. Equipment summary
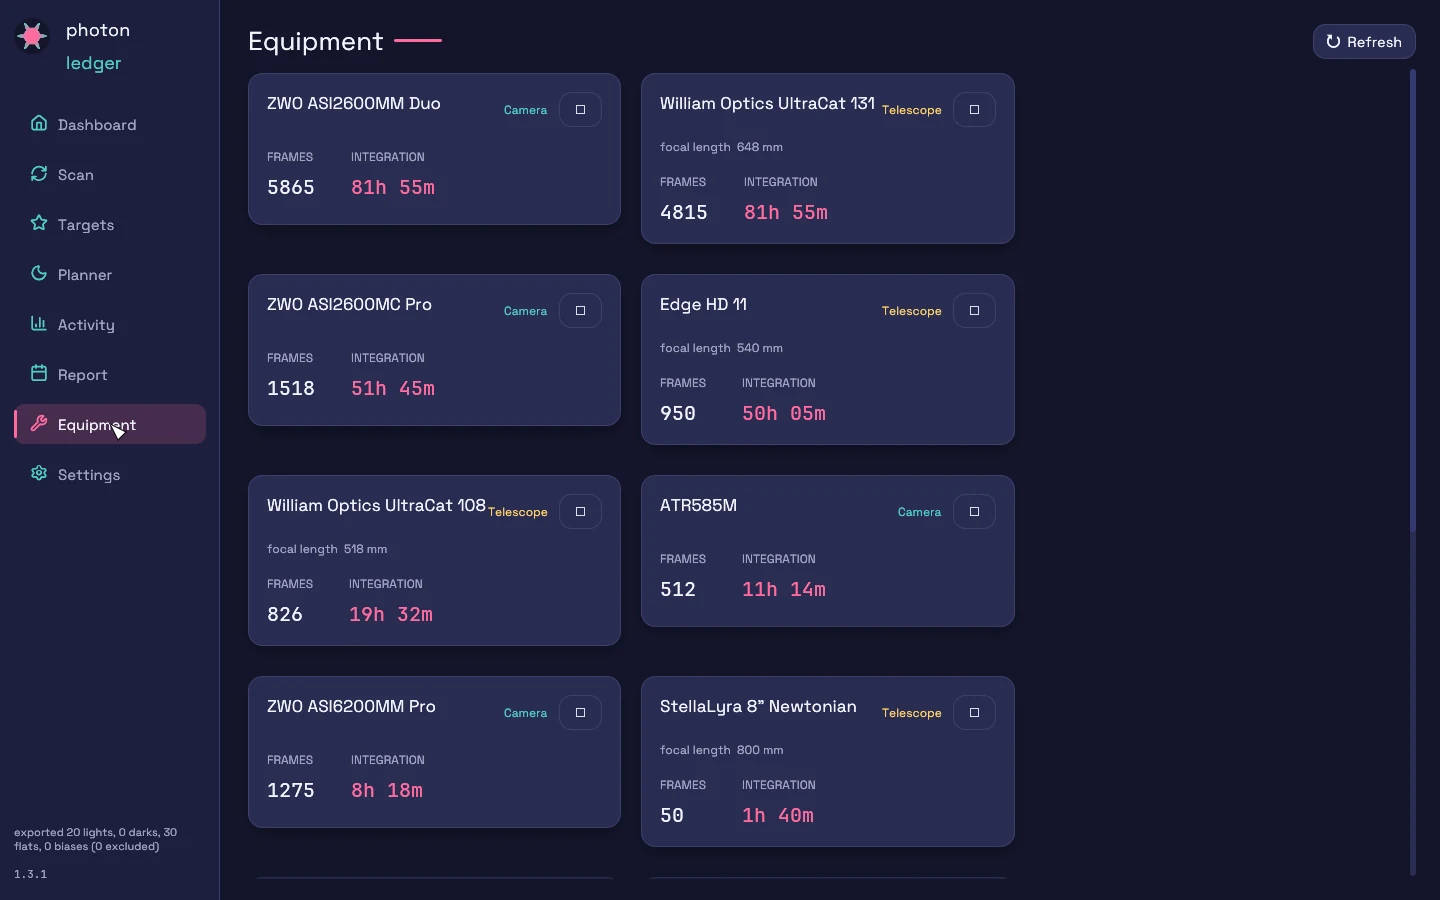
Photon Ledger reads camera and telescope names straight from your FITS headers and totals your usage per instrument. Each card shows the frame count and total integration for a piece of gear — here a ZWO ASI2600MM Duo with 64h 50m, a William Optics UltraCat 131 at 648 mm, a StellaLyra 8″ Newtonian, and more. It's a quick way to see which rig is actually earning its keep.
Headers being headers, the same device sometimes shows up twice under different spellings, and mount controllers occasionally leak into the telescope field. Each card's ⋯ menu fixes that: Rename (old header spellings keep matching the renamed row), Merge into… another entry of the same kind, or Reclassify — so an "OnStep" that arrived as a telescope can be filed as the mount it is. Merges survive re-scans.
12. Tonight's Picks — the planner
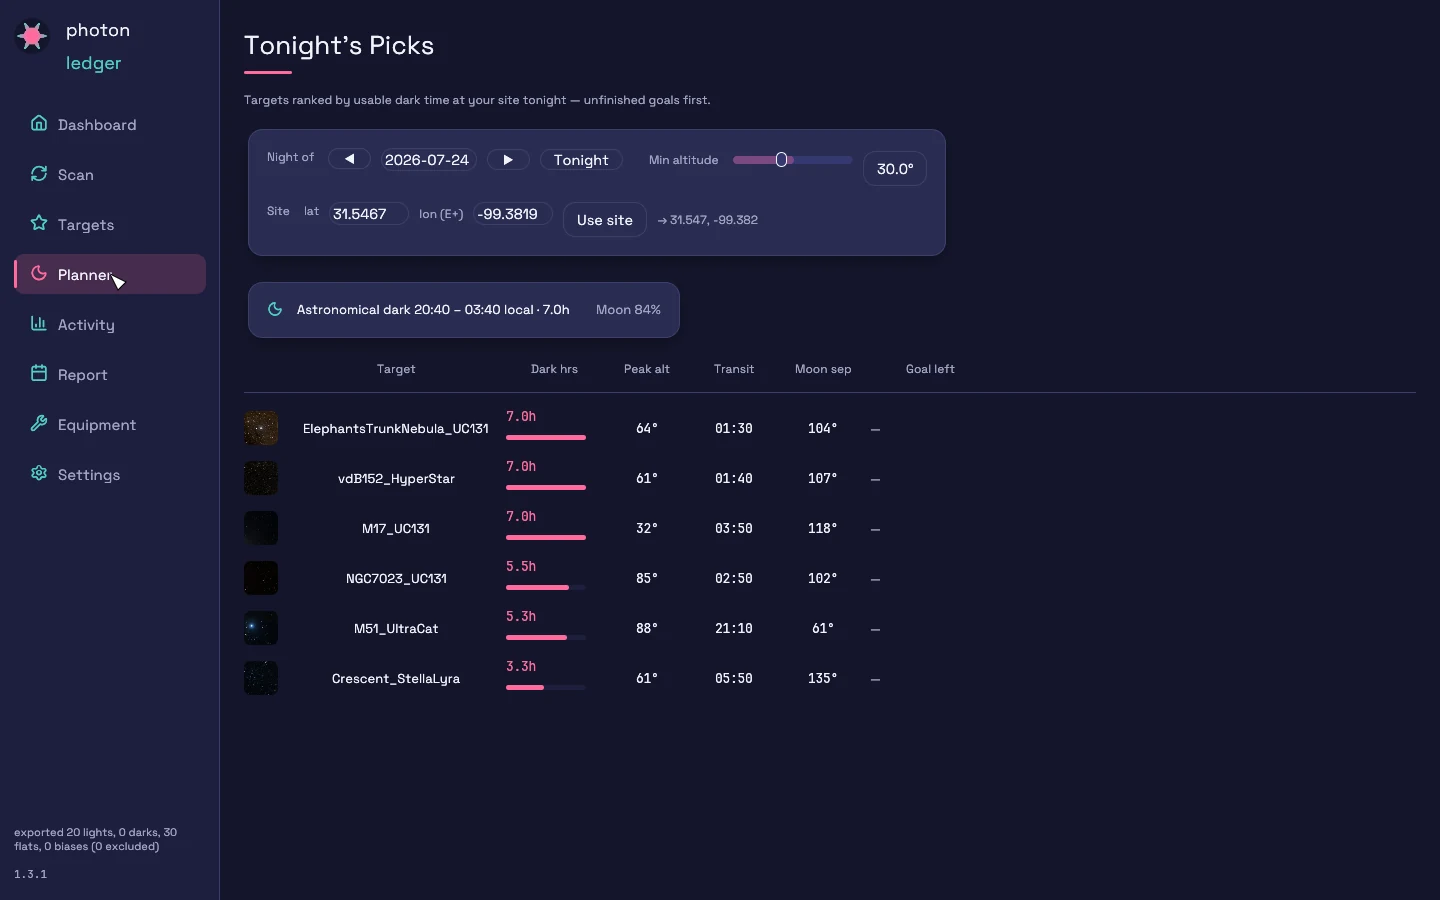
The Planner ranks the targets already in your library by how much usable dark time each one gets at your site tonight — factoring in altitude, astronomical darkness, transit time, and the moon, with your unfinished goals surfaced first. Your observing site is read automatically from your frames' SITELAT/SITELONG headers (or you can enter latitude and longitude by hand).
For the captured night it shows the dark window (20:40–03:40, 7.0h) and moon illumination (84%), then a ranked table of targets with dark hours, peak altitude, transit time, and moon separation — click any row to open that target. Only real candidates rank here: targets you've actually imaged, plus anything you imported as planned — scan debris from calibration frames is filtered out. Decide what to point at before you're standing in the cold.
13. Settings
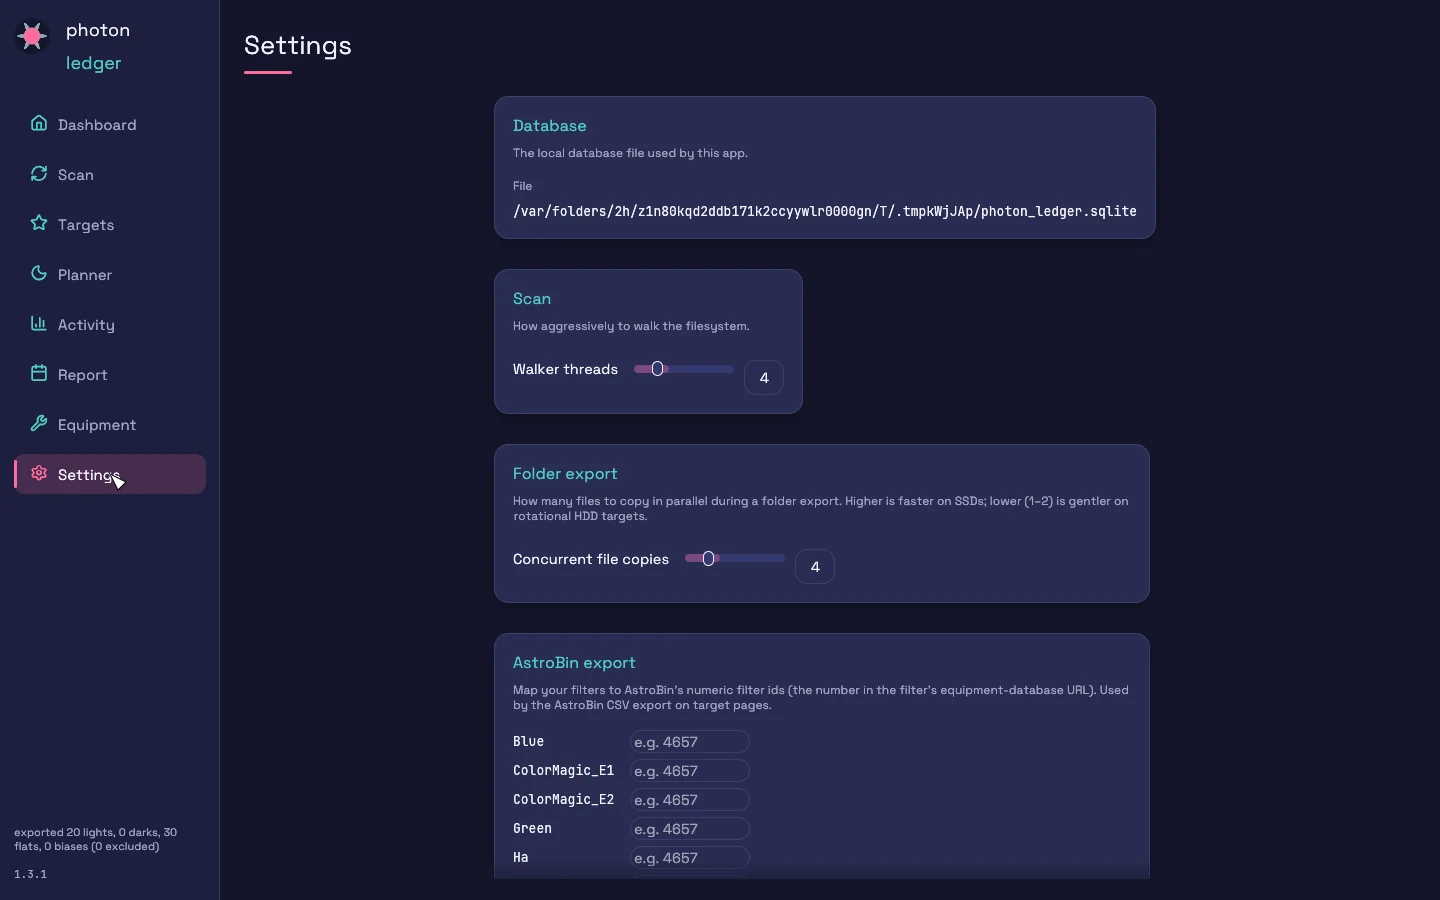
Settings collects the app's configuration: the database file in use, how aggressively the scanner walks the filesystem (walker threads), how many files to copy in parallel during a folder export (concurrent file copies — lower for spinning HDDs, higher for SSDs), and an AstroBin export section for mapping your filter names to AstroBin's numeric filter IDs so the AstroBin CSV export on each target page comes out correct.
Appearance
Pick how Photon Ledger looks. A change applies the moment you click it and is remembered the next time you open the app.
- Dark: light text on dark indigo. This is the standard look and the default.
- Light: dark text on light surfaces, for daytime use or a bright room.
- Night: red on black for use at the telescope, so the screen doesn’t spoil your dark adaptation. Everything turns red, including thumbnails, sky cutouts and charts, and large chart bars are dimmed.
- Match system: follows your computer’s Light or Dark appearance and switches when it does.
Licensing
Photon Ledger is proprietary software that is free to use, with every feature included — no license file and no frame cap. If it saves you time, you can support development.
Next steps
- Folder Export — the full WBPP/Siril output layout and calibration matching
- Exporting data — CSV export and integrating with external tools
- FAQ — privacy, licensing, NAS performance, supported FITS variants